Zerowatt Vitals · Industrial energy and process monitoring
See every machine. Live.
Every machine, meter and sensor in the plant, on one platform. Live readings, in rupees, on any screen, and an assistant that answers questions about the data.

- large industrial facilities across India
- 100+
- load under continuous monitoring
- 120 MW+
- data points analysed
- 125 bn+
- from gateway installed to data live
- <48 hrs
Product demo
See Zerowatt Vitals in action.
Who it’s for
No monitoring yet?
Start with complete monitoring.
Every meter, sensor and machine in the facility, live on one platform. Start with one system and add the rest as you go.
How it works
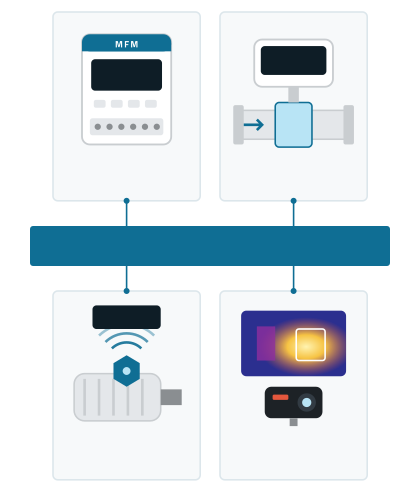
One gateway. One platform. Everything on it.
- Machines and utilitiesCompressors · Chillers · Boilers · Pumps · Motors · Fans · DG sets · Transformers · Production lines
- Meters and sensorsEnergy meters · Flow · Pressure · Temperature · Vibration · Thermal cameras · Operator logbook, on mobile
- Systems already on sitePLC · SCADA · DCS · BMS · Historian · SQL databases · Existing energy meters · Any monitoring platform

Zerowatt Edge Gateway
Reads the plant, read-only, with local backup through an outage.
- Modbus
- OPC UA
- BACnet
- SQL
- 4–20 mA
- Pulse / DI
Live
Zerowatt Vitals
One live timeline for the whole facility, costed at the plant’s own tariff. Cloud or on-premises.
<48 hrsfrom gateway installed to data live
Read-only · nothing written to control. The existing equipment is read as it is, with no change to the control system.
Coverage
One system covers all of it.
- 01Electricity
- 02Water
- 03Compressed air
- 04Steam
- 05Fuel
- 06Chillers & HVAC
- 07Process
- 08Vibration
- 09Temperature & pressure
- 10Thermal imaging
- 11Operator logbook

Field devices
What the plant already has, plus what is missing.
| Device | |
|---|---|
| Energy meters | Feeders, motors and panels |
| Flow meters | Water, steam, air and fuel |
| Temperature sensors | Process and utilities |
| Pressure sensors | Air, steam and water lines |
| Vibration sensors | Motors, fans and pumps |
| Thermal cameras | Panels, busbars and kilns |
| PLC, SCADA and DCS | Existing control data |
| Operator logbook | Manual rounds, recorded on mobile |
The platform
Fifteen things a plant usually buys separately.


Energy monitoring
Every incomer, feeder, panel, motor and transformer, down to the last MCC.
Water monitoring
Raw, process, cooling, ETP and STP: flow, consumption and energy per m³.
Air, steam and fuel
Flow, pressure and specific power across compressors, boilers and headers.
Chiller plant view
kW/TR, approach and both water circuits, per chiller and for the whole plant.
Custom dashboards
SCADA-style screens for any machine or process, laid out per plant.
Live single-line diagram
The plant’s own electrical one-line, with live loading and power quality on it.
Condition monitoring
Vibration and bearing temperature on motors, fans, pumps and gearboxes.
Thermal imaging
Images taken on rounds, filed against the equipment they show, beside its live data.
Digital logbook
Operator rounds on a phone: readings, run hours, lab results and inspections.
Metrics
Specific energy per line, product and shift: kWh/tonne, kW/TR, kcal/kg.
Custom analytics
Virtual meters and calculated readings, built from any combination of points.
Tariff and cost
Indian tariffs in full: slabs, time-of-day, demand and power factor.
Historian
One-second data, kept for as long as your contract runs.
Alerts
Rules set on whole equipment types, not single tags. Sent on WhatsApp and email.
Custom reports
Shift, daily and monthly, issued on their own: MIS in the plant’s own format.
Every module reads from the same data, so a kWh figure in a report is the same kWh figure on the dashboard.
Ask Zoe
Ask a question. Get the answer.
Ask about any machine
“Compressor consumption for the last two weeks” returns the energy, the cost, the break-up by machine and a report in the inbox.
Answers come with charts
Not a number on its own. The trend it came from is shown alongside, so it can be checked.
Ask about any chart on screen
Select a trend and a date range, and get a reading of that specific chart with the detail behind it.
Describe a dashboard and get it built
Say what the screen should show and Vitals builds it. No configuration request, no waiting.
Ask how to improve something
Zoe answers from recognised energy-efficiency guidelines and practice, and attaches the reference so the basis can be checked.
On the phone, in the plant
Android and iOS, so the answer arrives in the meeting rather than after it.

Each customer’s data is kept physically separate, and no customer data is used to train AI models, in Zoe or in any other feature.
Access and data
- Web and mobileAny browser · Android · iOS
- Unlimited usersAccess set by role and by section
- Your data stays yoursNever used to train AI models
Next step
Put AI agents on top of it.
See it on the plant that has to run it.
A Zerowatt engineer walks the facility, lists what is already measured and what is not, and comes back with a point list and a budgetary estimate. No obligation, and no interruption to production.